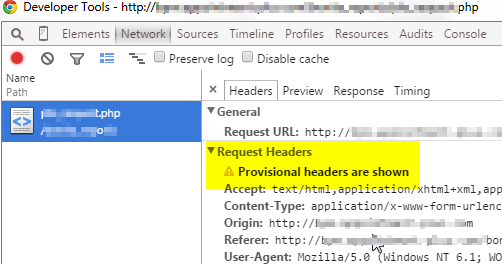
Provisional headers are shown
in Google chrome browser and Opera browser.
I digged some research on Google and find out mixed responses and at last I got it fixed by removing window.print() in script.
Check out all the fixed Provisional headers are shown answers from stackoverflow.
Few developers say that it is because of Chrome plugins like Adblock and VPN. Anyways check out all the responses.
The resource could be being blocked by an extension (AdBlock in my case).
The message is there because the request to retrieve that resource was never made, so the headers being shown are not the real thing. As explained in the issue you referenced, the real headers are updated when the server responds, but there is no response if the request was blocked.
I believe it happens when the actual request is not sent. Usually happens when you are loading a cached resource.
I had similar problem. I changed my button type=”submit” to type=”button”. It worked for me.
I’ve faced with the same issue while working through VPN. To solve the problem had to change the MTU value.
I encountered this issue, and I managed to identify a specific cause, which isn’t mentioned above either in answers or the question.
I am running a full js stack, angular front end and node back end on SSL, and the API is on a different domain running on port 8081, so I am doing CORS requests and withCredentials as I am dropping a session cookie from the API
So specifically my scenario was: POST request, withCredentials to port 8081 caused the “CAUTION: provisional headers are shown” message in the inspector and also of course blocked the request all together.
My solution was to set up apache to proxy pass the request from the usual SSL port of 443 to the node SSL port of 8081 (node has to be on a higher port as it cannot be ran as root in prod). So I guess Chrome doesn’t like SSL requests to unconventional SSL ports, but perhaps their error message could be more specific.
This caution message also occurs if the response is invalid and therefore dropped by the browser.
In my case the request was correctly sent to the server, the server-side code then produced an error and my custom error handling returned the error message in the HTTP status message field. But this error was not received on the client side, due to invalid characters in the error message (described here http://aspnetwebstack.codeplex.com/workitem/1386) which resulted in corrupt response headers.
I came across this and it went away when I switched from https to http. The SSL certs we use in dev aren’t verified by a 3rd party. They’re just locally generated dev certs.
The same calls work just fine in Chrome Canary and Firefox. These browsers don’t appear to be as strict about the SSL cert as Chrome is. The calls would fail in Chrome with the “CAUTION: Provisional headers…” message.
I think/hope that when we use a legit SSL cert in stage and prod, we won’t see this behavior in Chrome anymore.
I doubt my answer is in time to help you but others might find it helpful. I experienced a similar issue with a jQuery Ajax Post script that i created.
It turned out that i had a typo in the href attribute of the A tag that i was using to fire the post. I had typed href=”javacsript:;” (reversing the ‘s’ and the ‘c’ ).. this caused the script to try to refresh the page while the post was attempting to fire. corrected the typo and it worked perfectly fine for me.
Just throwing in my two cents. I’m writing a Web Application using CORS requests and a full RESTful web service. I have found chrome will throw this error when I have an unhanded exception or a PHP Error thrown. Just incase anyone else runs into the problem. I found that when this happens I can fire up the Chrome App “Postman – Rest Client” and run the exact same request but in the Chrome App I’ll actually get the PHP Error thats being thrown instead of this non descriptive error.
Here is another solution.
If you encounter this issue with $ajax() call, add http:// before your serverhost will solve your problem.
var requestURL = “http://” + serverHost; $.ajax({ dataType: “json”, url: requestURL, data: data, success: success });
I ran into this issue with an AJAX call that would never complete. I followed wvega’s advice and tip about debugging with chrome://net-internals to eventually determine another click event handler in the page, listening on a parent node, was causing the browser to navigate to the same URL (so it wasn’t easily noticeable).
The solution was to add event.stopPropagation() in a click handler on the form submit button to keep the click from bubbling up the DOM and canceling the AJAX request in progress (initiated via a submit handler on the form).
I ran this issue when I tried to load main.js for require js for the second time after I made changes as a result from error . I just turned on in Developer Tools Settings “Disable Cache (When DevTools is Open)” . and that did the charm.
Another possible scenario I’ve seen – the exact same request is being sent again just after few milliseconds (most likely due to a bug in the client side).
In that case you’ll also see that the status of the first request is “canceled” and that the latency is only several milliseconds.
I’ve had this come up very recently (today in fact) where I’ve had an AJAX call go out to the server and Chrome fires off the “Caution: Provisional headers are shown.” In the server side PHP scripting, there are MySQL queries that can be pretty much instant or take a few seconds depending on the given scenario. My server response isn’t sent back to the browser until the queries are completed. I’ve found I get this error only when time consuming queries (up to a few seconds total) are being done and prevent the response from being sent back.
My scenario involves the very rare possibility of having to alter a table by adding/removing hundreds of columns for weather model output…hence the response lag from iterating through a loop of ALTER TABLE queries.
This was happening for me, when I had a download link and after clicking on it I was trying also to catch the click with jquery and send an ajax request. The problem was because when you are clicking on the download link, you are leaving the page, even it does not look so. If there would no file transfer, you would see the requested page.. So I set a target=”_blank” for preventing this issue.
I got this error when I tried to print a page in a popup. The print dialog was show and it still waiting my acceptance or cancellation of the printing in the popup while in the master page also was waiting in the background showing the message CAUTION provisional headers are shown when I tried to click another link.
In my case the solution was to remove the window.print (); script that it was executing on the body tag of the popup window to prevent the print dialog.
A common reason this happens is if you are tracking an event and you don’t prevent the default action. For example, if you have a click event, then you will want to include:
e.preventDefault();
or
return false;
If you don’t, you will see the provisional headers warning as well as a “canceled” status in the Network tab of your web console.
If you are developing an Asp.Net Mvc application and you are trying to return a JsonResult in your controller, make sure you add JsonRequestBehavior.AllowGet to the Json method. That fixed it for me.
public JsonResult GetTaskSubCategories(int id) { var subcategs = FindSubCategories(id); return Json(subcategs, JsonRequestBehavior.AllowGet); //< Notice it has two parameters } When chrome redirect to a new url, some http requests will be canceled immediatly, you will find ‘provisional headers are shown’ in debug console.
Above anwers are took from stackoverflow and other sites for only informational purpose.